In the last post I migrated a Grafana database to a new server and took the opportunity to upgrade the Grafana version in the process.
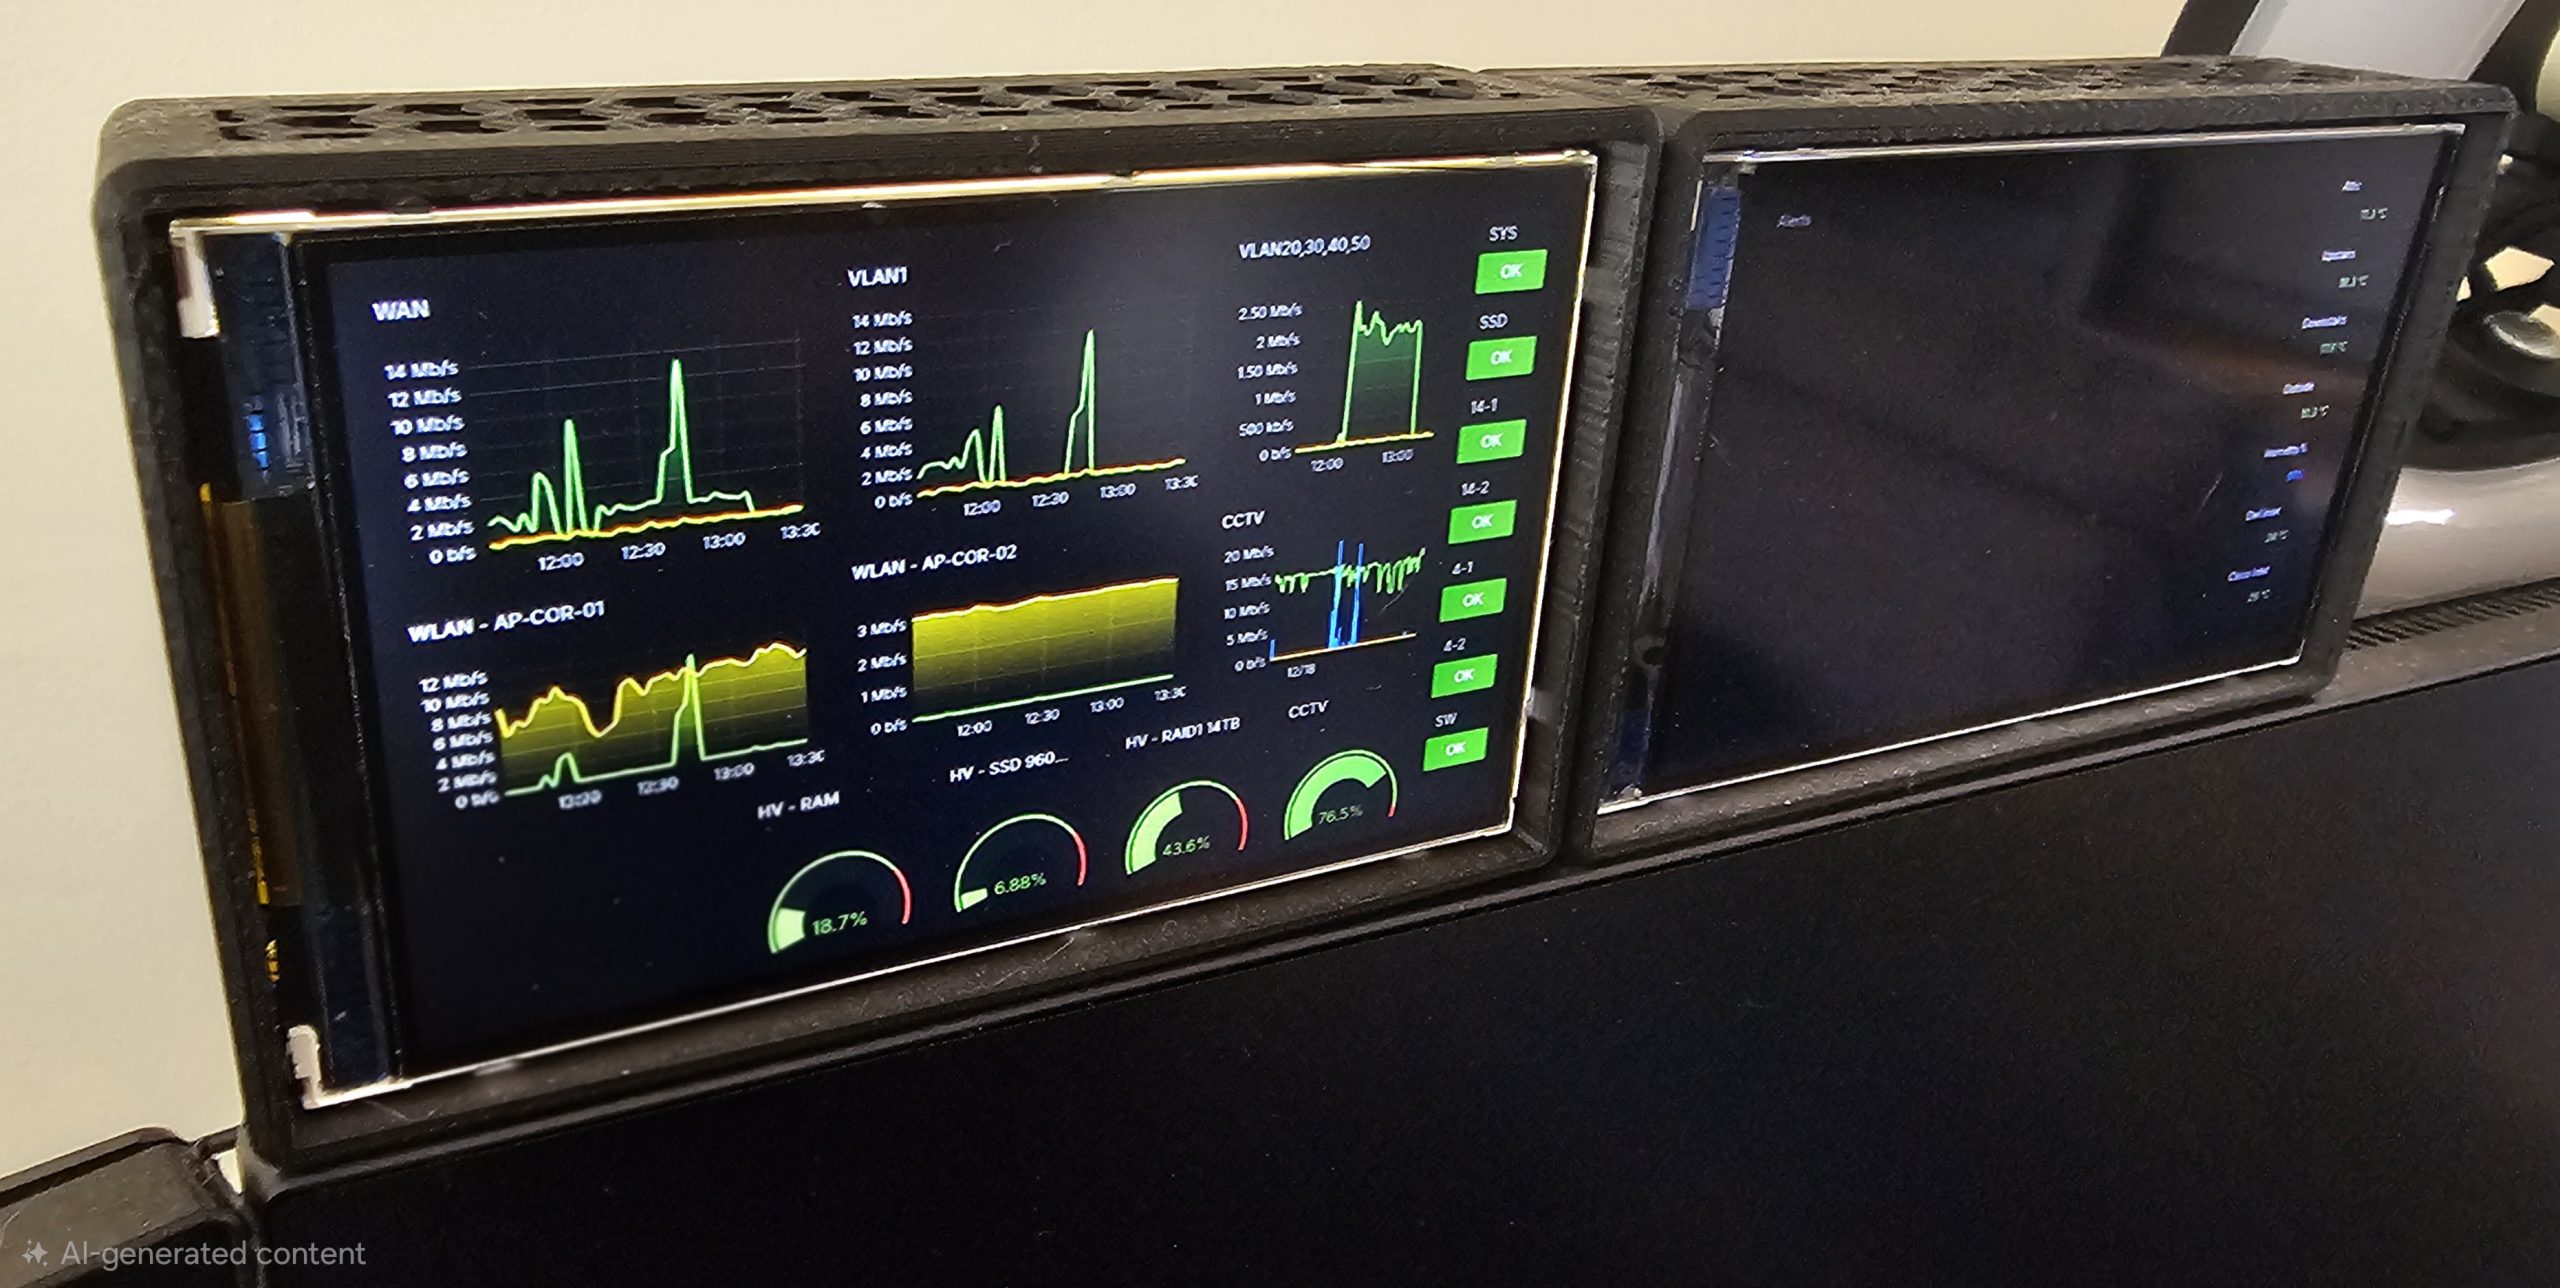
This created a new issue, since Grafana’s supported browser list moves with the times, my two “NOC” screens consisting each of a Raspberry Pi 3A running Raspbian Buster and Hyperpixel 4.0 screens no longer worked. Instead, the outdated Chromium browsers now displayed the “If you’re seeing this Grafana has failed to load its application files” page when visiting the Grafana web interface.
Bringing the OS on the Pi’s up to date is the logical resolution, however, there are a couple of issues with this:
- One of the Hyperpixel 4.0 screens is an early revision model, meaning the official and legacy drivers do not work.
- Even with working screen drivers, compatible browsers will not load on the 512MB RAM available to the Pi 3A.
Not wanting to obsolete a pair of Pi 3A’s with a now unique form factor, instead a workaround was found to continue displaying Grafana dashboards on this older hardware. The solution even gave a slight benefit over the original URL…
To achieve this, Grafana has released grafana-image-renderer, essentially a binary with a self-contained and headless Chromium instance that will load a dashboard and capture an image of the output.
Until recently, this was available as a Grafana plugin, however this plugin has since been depreciated in favour of it being a standalone application or docker container. A lot of online documentation still refers to it in its plugin form and so is now outdated.
The current iteration of grafana-image-renderer recommends using it within a docker container due to the potential resource usage it can generate. However, for this guide, only the standalone binary will be used as its only generating two images, and I find resource usage is at a minimum.
Installation
Firstly, grab the binary and store it in a easy but sensible location:
cd /opt
wget https://github.com/grafana/grafana-image-renderer/releases/download/v5.0.6/grafana-image-renderer-linux-amd64
Then make the file executable:
chmod +x grafana-image-renderer-linux-amd64To have it run as a service, create a service file for it:
nano /etc/systemd/system/grafana-image-renderer.serviceAnd populate the file with the following:
[Unit]
Description=Grafana Image Renderer service
After=network.target

[Service]
ExecStart=/opt/grafana-image-renderer-linux-amd64 server --
WorkingDirectory=/opt/
Restart=on-failure
User=root
Environment=GRAFANA_RENDERER_PLUGIN_STARTUP_TIMEOUT=30s
[Install]
WantedBy=multi-user.target
Reload the service daemon, start the new service, and check it is running:
systemctl daemon-reload
systemctl start grafana-image-renderer.service
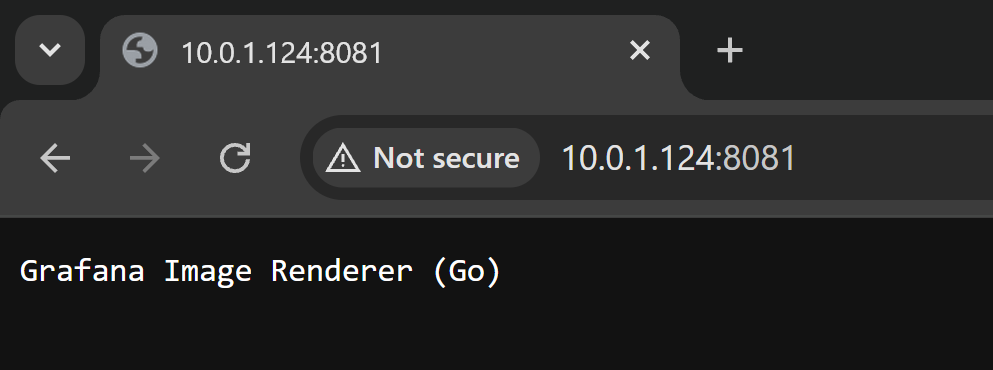
systemctl status grafana-image-renderer.serviceYou can check If the service is running by visiting the web page of the server on port 8081:
Authentication
A default Grafana server install requires login before being able to see any dashboards, this extends to the image renderer. As we can’t login to the web interface interactively within the service, a service account needs to be created.
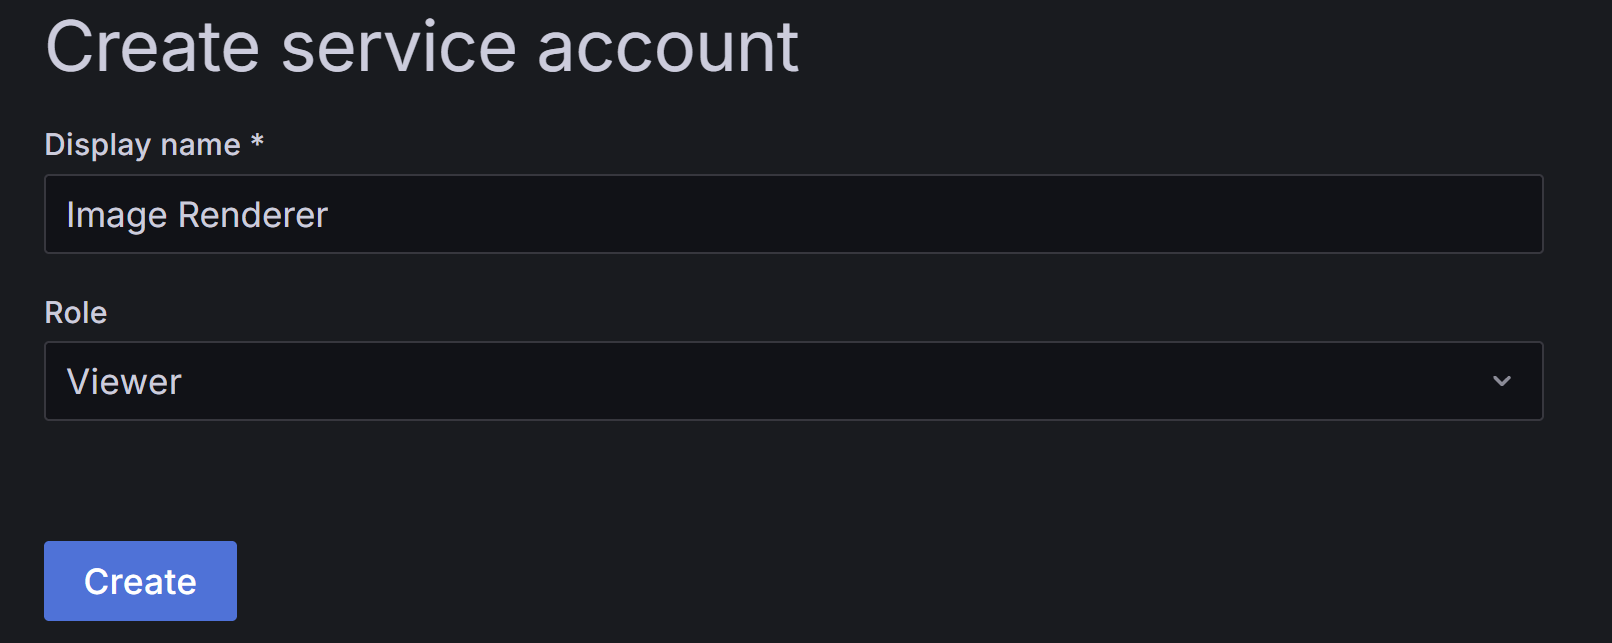
In the main Grafana web interface, login and navigate to Home > Administration > Users and access > Service accounts, then click “Add service account”.
Give it a display name and set the role to viewer:
Now in the newly created service account, click “Add service token”, then on the popup dialog, click “Generate Token”.
A token with a “glsa_” prefix is displayed, make a copy of this as it will not be available to view after closing this dialog box:
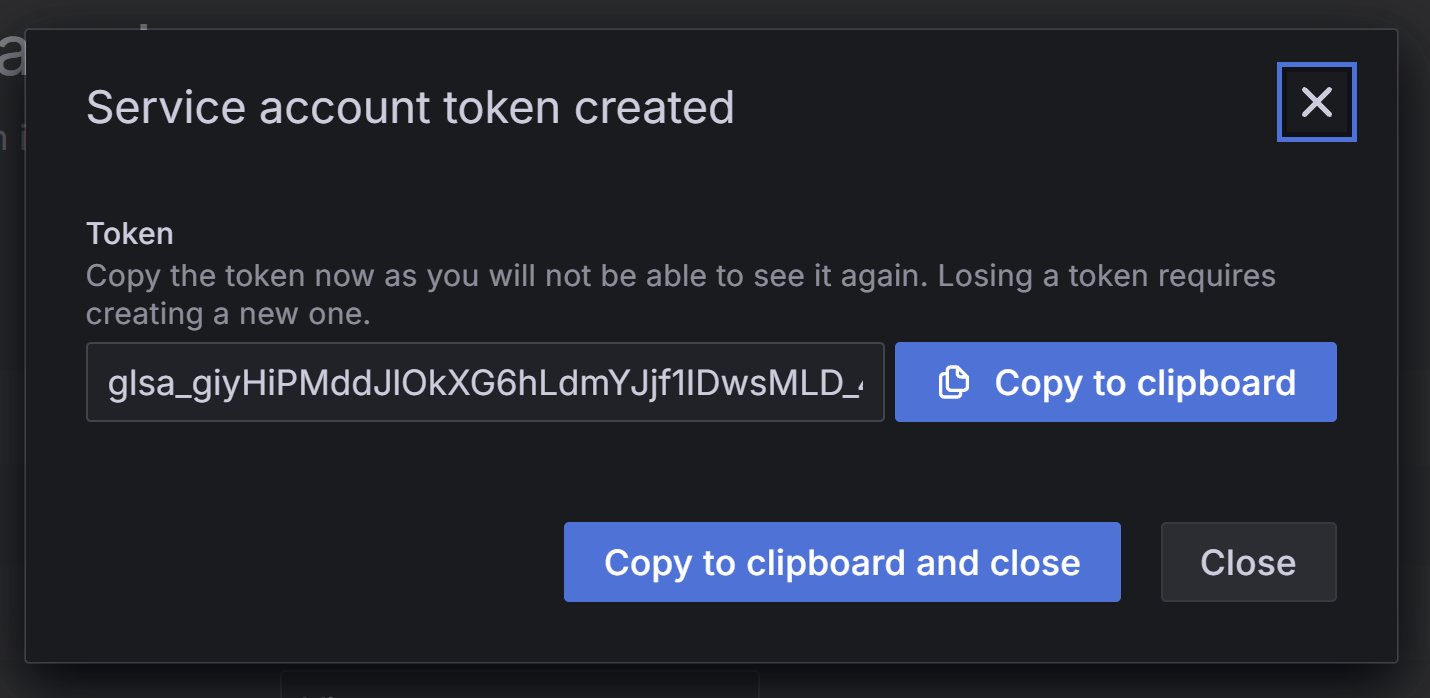
This will be used as authentication when generating our dashboard images…
Generating Images
With the renderer installed, and authentication available, images can now be generated.
Images are generated by requesting a URL from the service with the dashboard within the variables, the syntax is:
http://{grafana-image-renderer}:8081/render?encoding=png&url=http://{grafana-dashboard}?{options}Where:
Grafana-image-renderer – The IP of the machine the renderer is running on.
Grafana-dashboard – The URL of the dashboard you’d like to capture.
Options – Options to manipulate the output/how the dashboard is displayed.
However, the authentication header is needed to successfully access the dashboard. For this reason its easier to use a curl command to set the headers and grab the image
For example, if the renderer is running on the same machine as the main Grafana, a dashboard can be generated by executing:
curl -H "X-Auth-Token: {glsa_token}" "http://localhost:8081/render?encoding=png&url=http://localhost:3000/d/{id}/{dashboad}?kiosk&width=800&height=600" -o image.pngThe options used here is kiosk; to remove the menus from the output, and height and width to match the intended displays.
Automation:
One minute updates are fine for this use case, so the easiest way automate this is via cron. Using crontab -e, add the following line:
/usr/bin/curl -H "X-Auth-Token: {glsa_token}" "http://localhost:8081/render?encoding=png&url=http://localhost:3000/d/{id}/{dashboard}?kiosk&width=800&height=600" -o /var/www/html/dash1.pngThis line generates the dashboard every minute and stores it on the default web server directory, allowing it to be viewed on the network via an installed web server.
But this will only create a static image, to allow the image to update on a display, a simple webpage can be created and stored on the webserver for easier access and reference.
Create a new webpage:
nano /var/www/html/dashboard.htmlAnd paste the following:
<!DOCTYPE html>
<html lang="en">
<head>
  <meta charset="UTF-8">
  <meta name="viewport" content="width=device-width, initial-scale=1.0">
  <title>Grafana Dashboard</title>
  <style>
    body {
      margin: 0;
      background-color: black;
      display: flex;
      justify-content: center;
      align-items: center;
      height: 100vh;
    }
    img {
      max-width: 100%;
      max-height: 100%;
      object-fit: contain;
    }
  </style>
</head>
<body>
  <img id="liveImage" src="dash1.png" alt="Live Image">
  <script>
    const img = document.getElementById("liveImage");
    setInterval(() => {
      const timestamp = new Date().getTime(); // avoid browser cache
      img.src = "dash1.png?t=" + timestamp;
    }, 60000); // 60 seconds
  </script>
</body>
</html>
When visited, this webpage will update the same image (dash1.png) every 60 seconds to ensure the browser updates with the latest available image instead of caching.
Displays
Viewing this on the display is as simple as visiting the above webpage. As the html is served from the Grafana server and where the auto refresh is taken care of, as long as the display is able to load the page, all is taken care of at the Grafana server.
Summary
Since all that is required from a display is being able to load and render a static image, this allows the oldest and slowest machines to be able to display a Grafana dashboard, negating the need to keep the displays up to date with Grafana’s evolving browser support.
I wish I learnt of this sooner, as it gives more standardised control of the layout of a dashboard. The HyperPixel displays are quite high resolution for their size, and loading a dashboard natively often lead to frustrations with the layout of panels not matching that displyed on a laptop/desktop screen. Presumably due to scaling. Using the image render allows you to test and fix the layout before deploying to a screen, and with a higher panel density too.
Another benefit is that most processing is taken away from the Pi 3A’s, as it is now only responsible for displaying a simple webpage with a single image, rather than loading the full Grafana UI. The Pis have been running on this new method for over a month without any lockups, which was previously seen on a weekly basis.