The aim of deploying Zabbix and adding SNMP to Gentoo was to gain better insight on how an Asterisk PBX was performing.
Last of the hurdles was to get data from Asterisk in order to send to Zabbix, however the traditional way of loading the res_snmp.so module in Asterisk was not available, as while the PBX in question utilises Asterisk, its buried under proprietary licensing and a non-standard api, therefore being unable to either add the SNMP module or to query it.
If you are experiencing a similar situation, here is how to extract some stats from Asterisk 16 using SNMP, but without the SNMP module…
Despite not being able edit Asterisk code directly, SSH access and the Asterisk CLI is available, so can run commands to return a snapshot of PBX activity.
The following commands can be run to output some valuable info:
asterisk -rx ‘pjsip show endpoints’ returns total number and current online endpoints, as well as reported user agent of device.
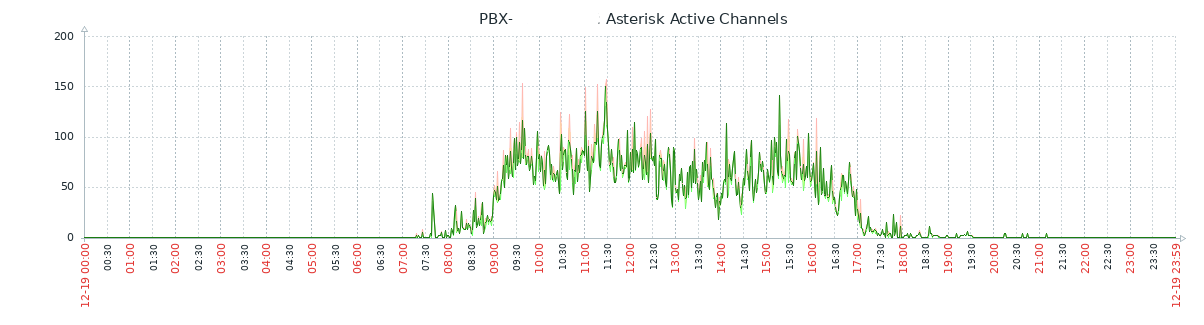
asterisk -rx ‘core show channels verbose’ gives us a list of active channels and current point in an inbound call flow, along with a counter of completed calls.
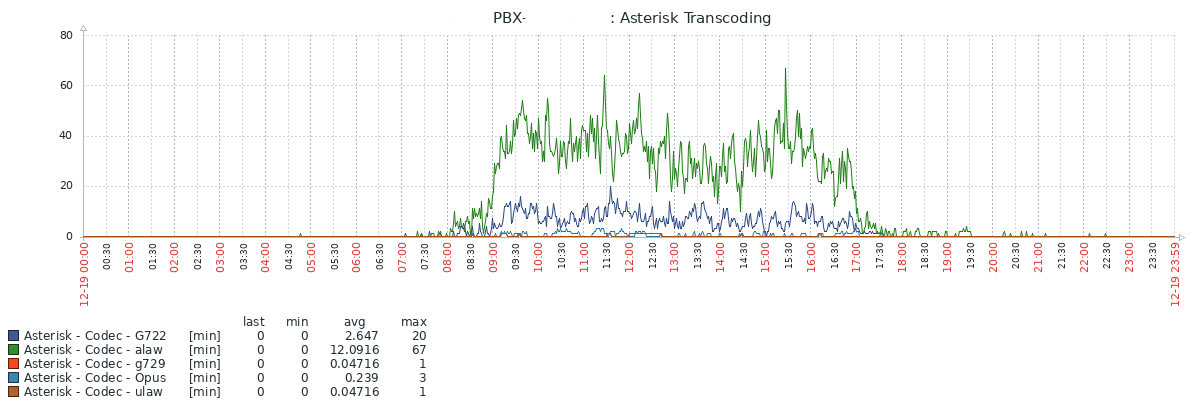
asterisk -rx ‘pjsip show channelstats’ is similar to ‘show channels verbose’, but includes the codec in use, helpful to determine if the system is transcoding.
Scripts
To get and output just the info required, a script can be created to parse the command output and list each value on a new line.
Create the three files below and paste the code in.
In this example I saved to /usr/local……
asterisk_chan.sh
command_output=$(asterisk -rx 'core show channels')

active=$(echo "$command_output" | grep -oE '[0-9]+ active channels' | grep -oE '[0-9]+')
processed=$(echo "$command_output" | grep -oE '[0-9]+ calls processed' | grep -oE '[0-9]+')

echo "$active"
echo "$processed"
asterisk_chanstat.sh
command_output=$(asterisk -rx 'pjsip show channelstats')

opus=$(echo "$command_output" | grep 'opus' | (wc -l))
g722=$(echo "$command_output" | grep 'g722' | (wc -l))
alaw=$(echo "$command_output" | grep 'alaw' | (wc -l))
ulaw=$(echo "$command_output" | grep 'ulaw' | (wc -l))
g729=$(echo "$command_output" | grep 'ulaw' | (wc -l))
total=$(echo "$command_output" | grep -oP 'Objects found: \K\d+' || echo 0)

echo "$opus"
echo "$g722"
echo "$alaw"
echo "$ulaw"
echo "$g729"
echo "$total"
asterisk_endpoint.sh
command_output=$(asterisk -rx 'pjsip show endpoints')

avail=$(echo "$command_output" | grep 'Avail' | (wc -l))
total=$(( $(echo "$command_output" | grep -c 'Endpoint') - 1 ))

echo "$avail"
echo "$total"
Saved, they need to be made executable, add the execute flag to each file…
chmod +x /usr/local/asterisk_chan.sh
chmod +x /usr/local/asterisk_chanstat.sh
chmod +x /usr/local/asterisk_endpoint.sh
SNMP extend_sh
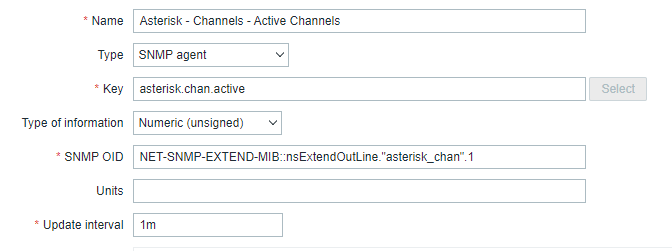
SNMP has an extension feature to add and poll your own custom data, to take advantage of this the snmp.d.conf file need to include reference and path to the scripts. At the bottom of snmpd.conf, add the following lines…
extend-sh asterisk_chan /usr/local/share/snmp/rps/asterisk_chan.sh
extend-sh asterisk_chanstat /usr/local/share/snmp/rps/asterisk_chanstat.sh
extend-sh asterisk_endpoint /usr/local/share/snmp/rps/asterisk_endpoint.sh
Restart snmpd to load changes…
Gentoo:
/etc/init.d/snmpd restartRHEL:
systemctl restart snmpdTesting
Using snmpget command locally or on your collector machine, test that its working..
snmpget -c }your-community} -v 2c {ip-address} 'NET-SNMP-EXTEND-MIB::nsExtendOutLine."asterisk_chan".1'Where “asterisk_chan” is the name of the extend_sh created in snmpd.conf file, and .1 on the end collates to the line of script output, .2 returns the second line and so on.
Add to monitoring
When adding to your monitoring system, in this example Zabbix, use the command listed in the testing phase to grab the values…
Logging and monitoring is now enabled for the Asterisk service…